
Wants it lower.
Red candles, liquidations, capitulation. Right in the crash, early or late everywhere else.
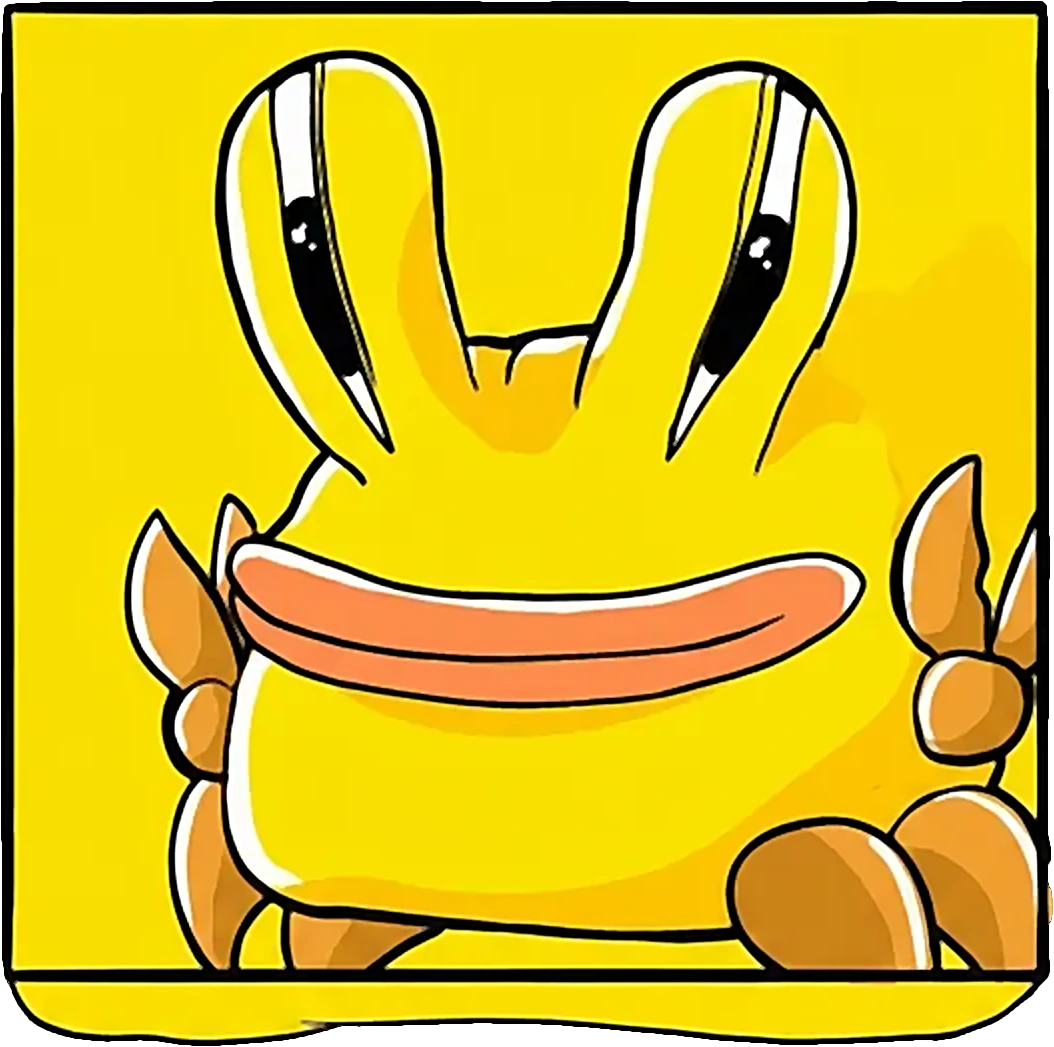 Snibbu
01 · The thesis
Three markets, one chart
Each regime below is a real stretch of BTC/USDT daily candles, rebased to 0% at its first open. The crab is the market as it stands today. Switch between them and watch the same asset tell three different stories.
Sideways = crabby
The pinned post on @snibbu_the_crab puts the thesis in one picture. Mumu parachutes in on green. Bobo parachutes in on red. A line of crabs clips every candle back into the range, and the chart goes nowhere.
See it on X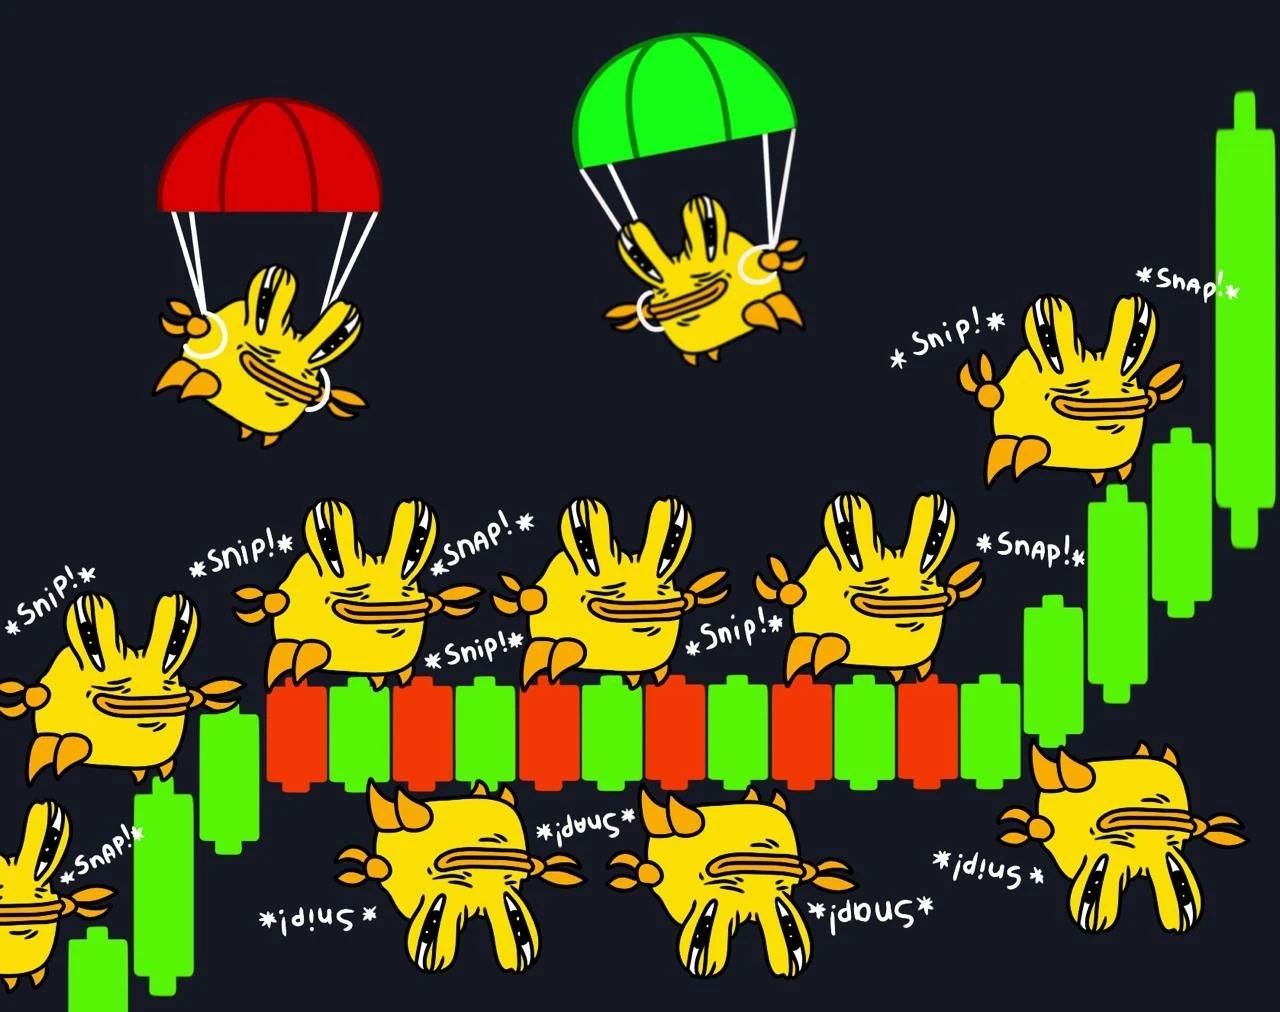
The pantheon
Bobo and Mumu are internet folklore: the bear who dumps it, the bull who pumps it. Snibbu is the third deity, the one standing between them for the long stretches when neither gets his way.
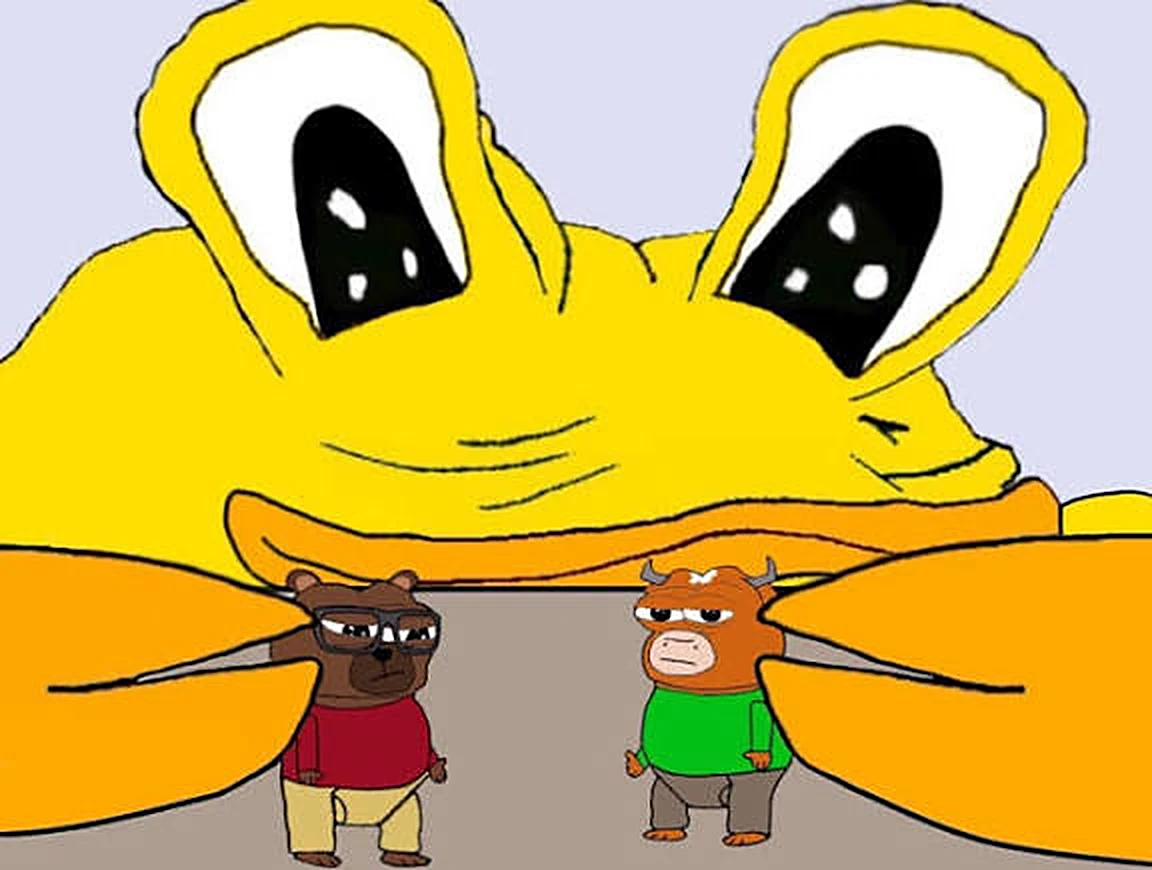
Red candles, liquidations, capitulation. Right in the crash, early or late everywhere else.
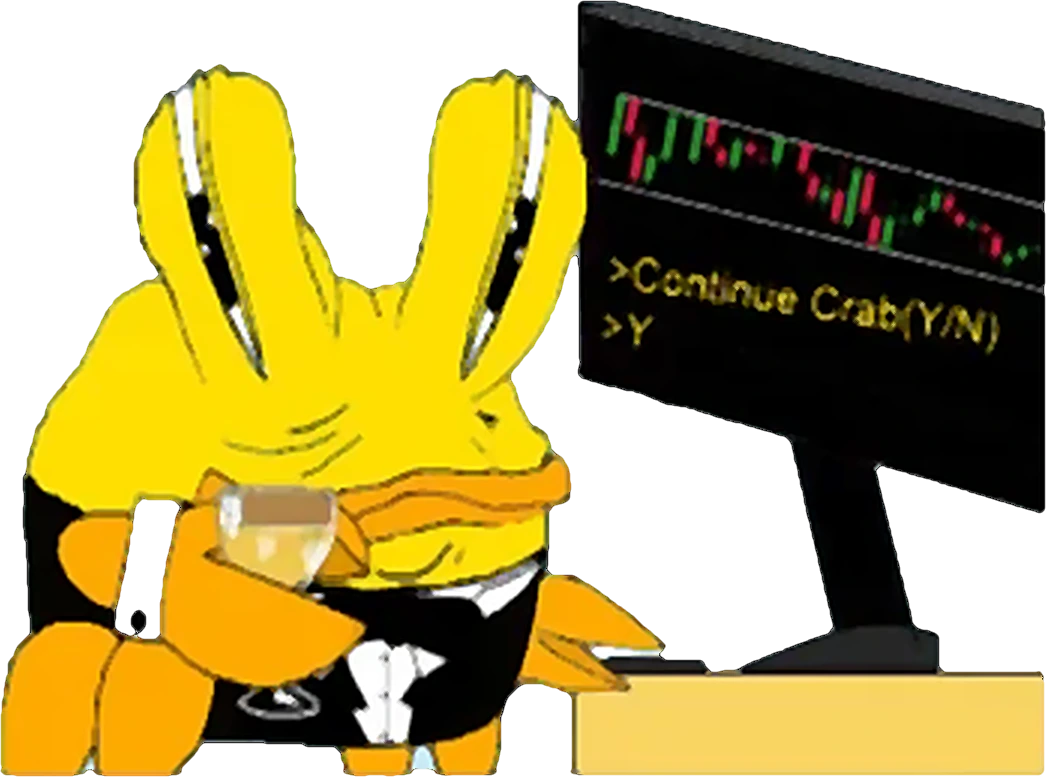
Up or down, he goes sideways. His terminal asks one question every morning: continue crab? The answer is always yes.
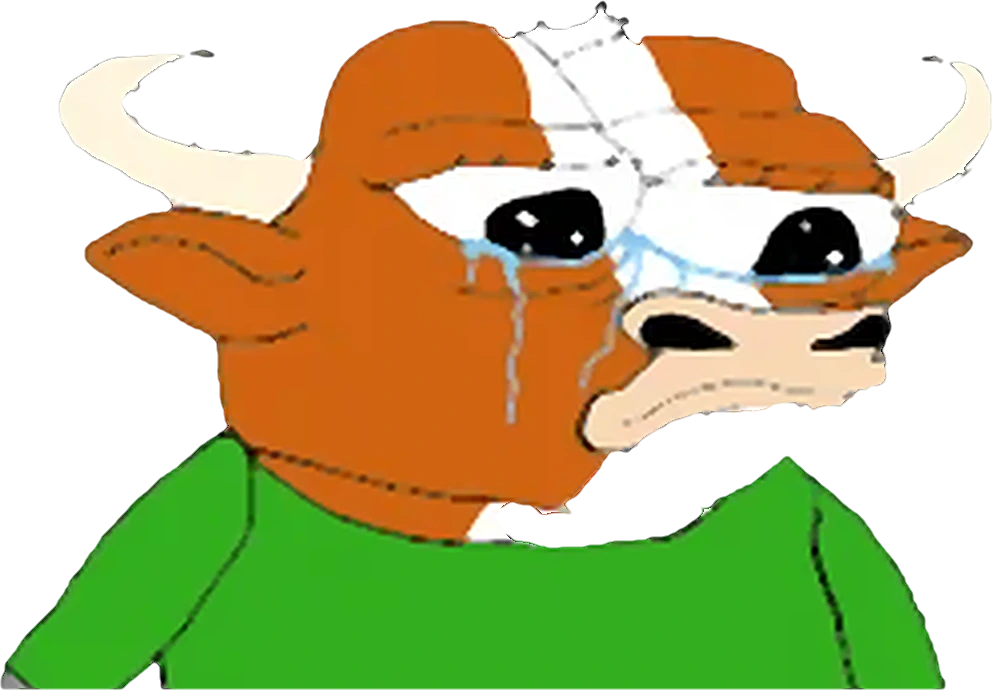
Green candles, breakouts, euphoria. Right in the run, and crying when the range comes back.
The doctrine
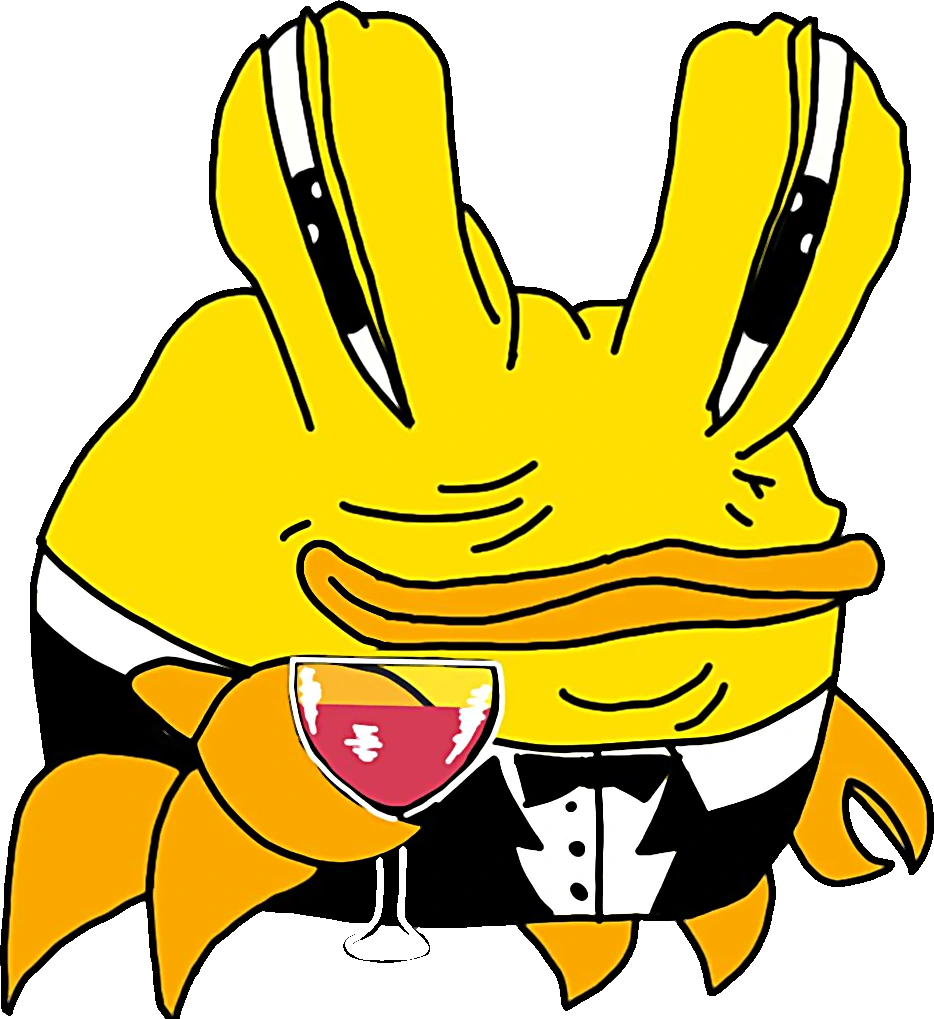
A chart has no duty to pick a direction. Most of the time it doesn't, and the only thing with an opinion is your position.

Conviction isn't built in green months. It is grown in the flat ones, one indifferent day at a time.
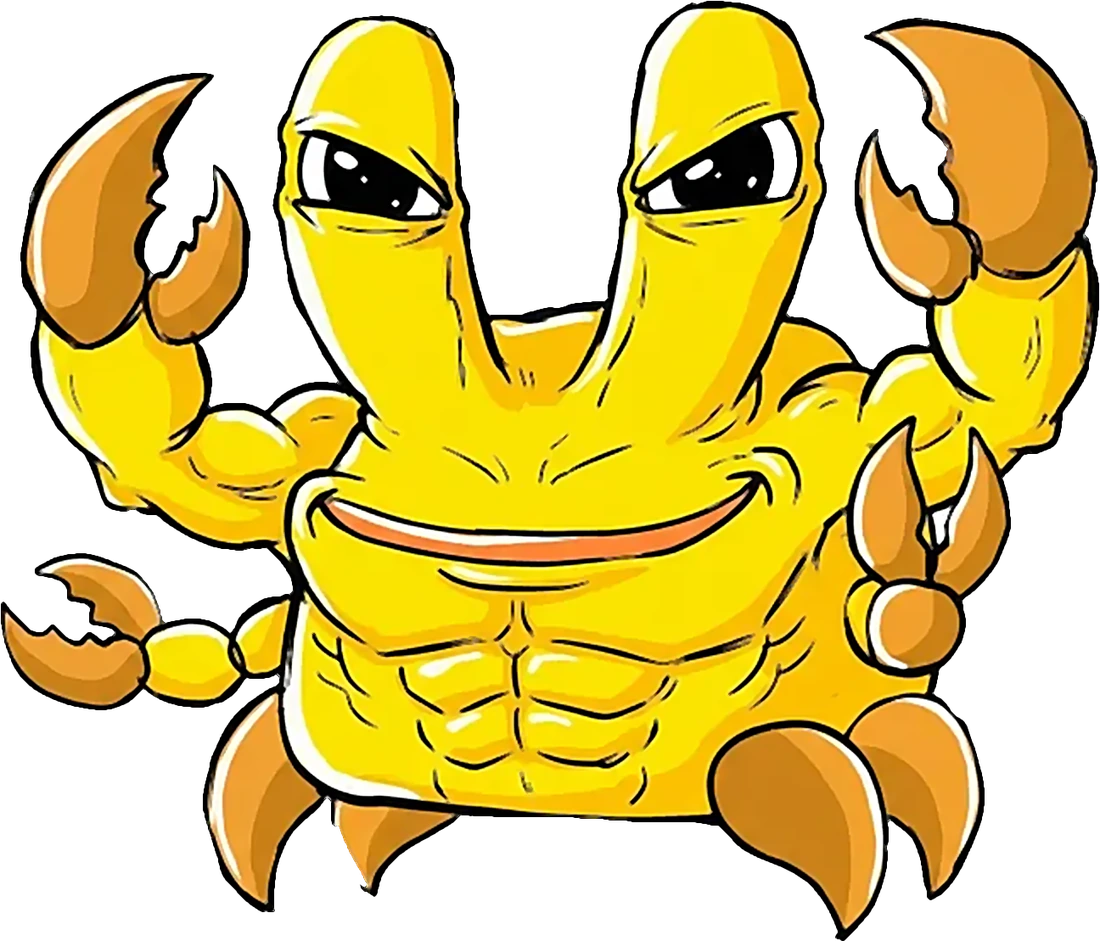
Up is a rumour and down is a rumour. The range is the one thing the market keeps coming back to.